The NEXRAD Tools for Javascript released earlier this year now have a demo available! As discussed in the history of the libraries it would be cost prohibitive for me to make nationwide radar images available. But I’ve found an effective way to make some of the images I use every day available.
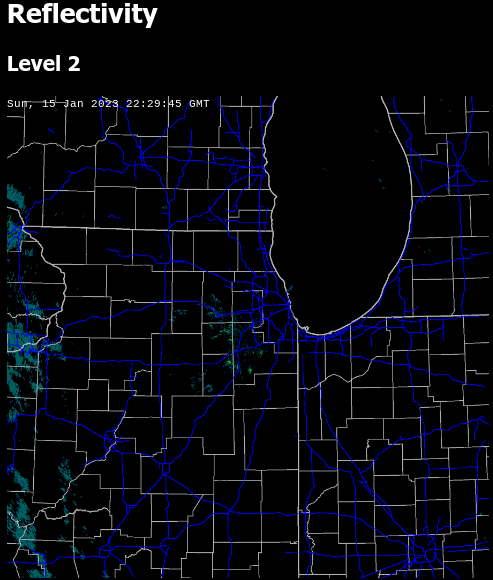
The demo shows level 2 plots for reflectivity and velocity and level 3 data for the hybrid hydrometer classification. It also includes a timestamp and road/county overlay on the radar image for reference, but those items are not part of the actual plotting libraries. The plots shown on the demo web site are updated in real-time, but a page refresh is required to load the latest image.
The complete set of tools is available on GitHub.
- nexrad-level-2-data, parses level 2 data files and returns them as a JSON object.
- nexrad-level-2-plot, plots data from the above package.
- nexrad-level-3-data, parses level 3 data files and returns them as a JSON object.
- nexrad-level-3-plot, plots data from the above package where applicable. Some level 3 data is tabular or text-only.